Search
HSS 2018-2023: Trend analysis of Basra, Iraq (English)
This document presents the main findings of the Human Security Survey in Basra from 2018 to 2023, with a presentation of observed trends on security perception, security actor performance, and conflict/peace dynamics.
Main conclusions
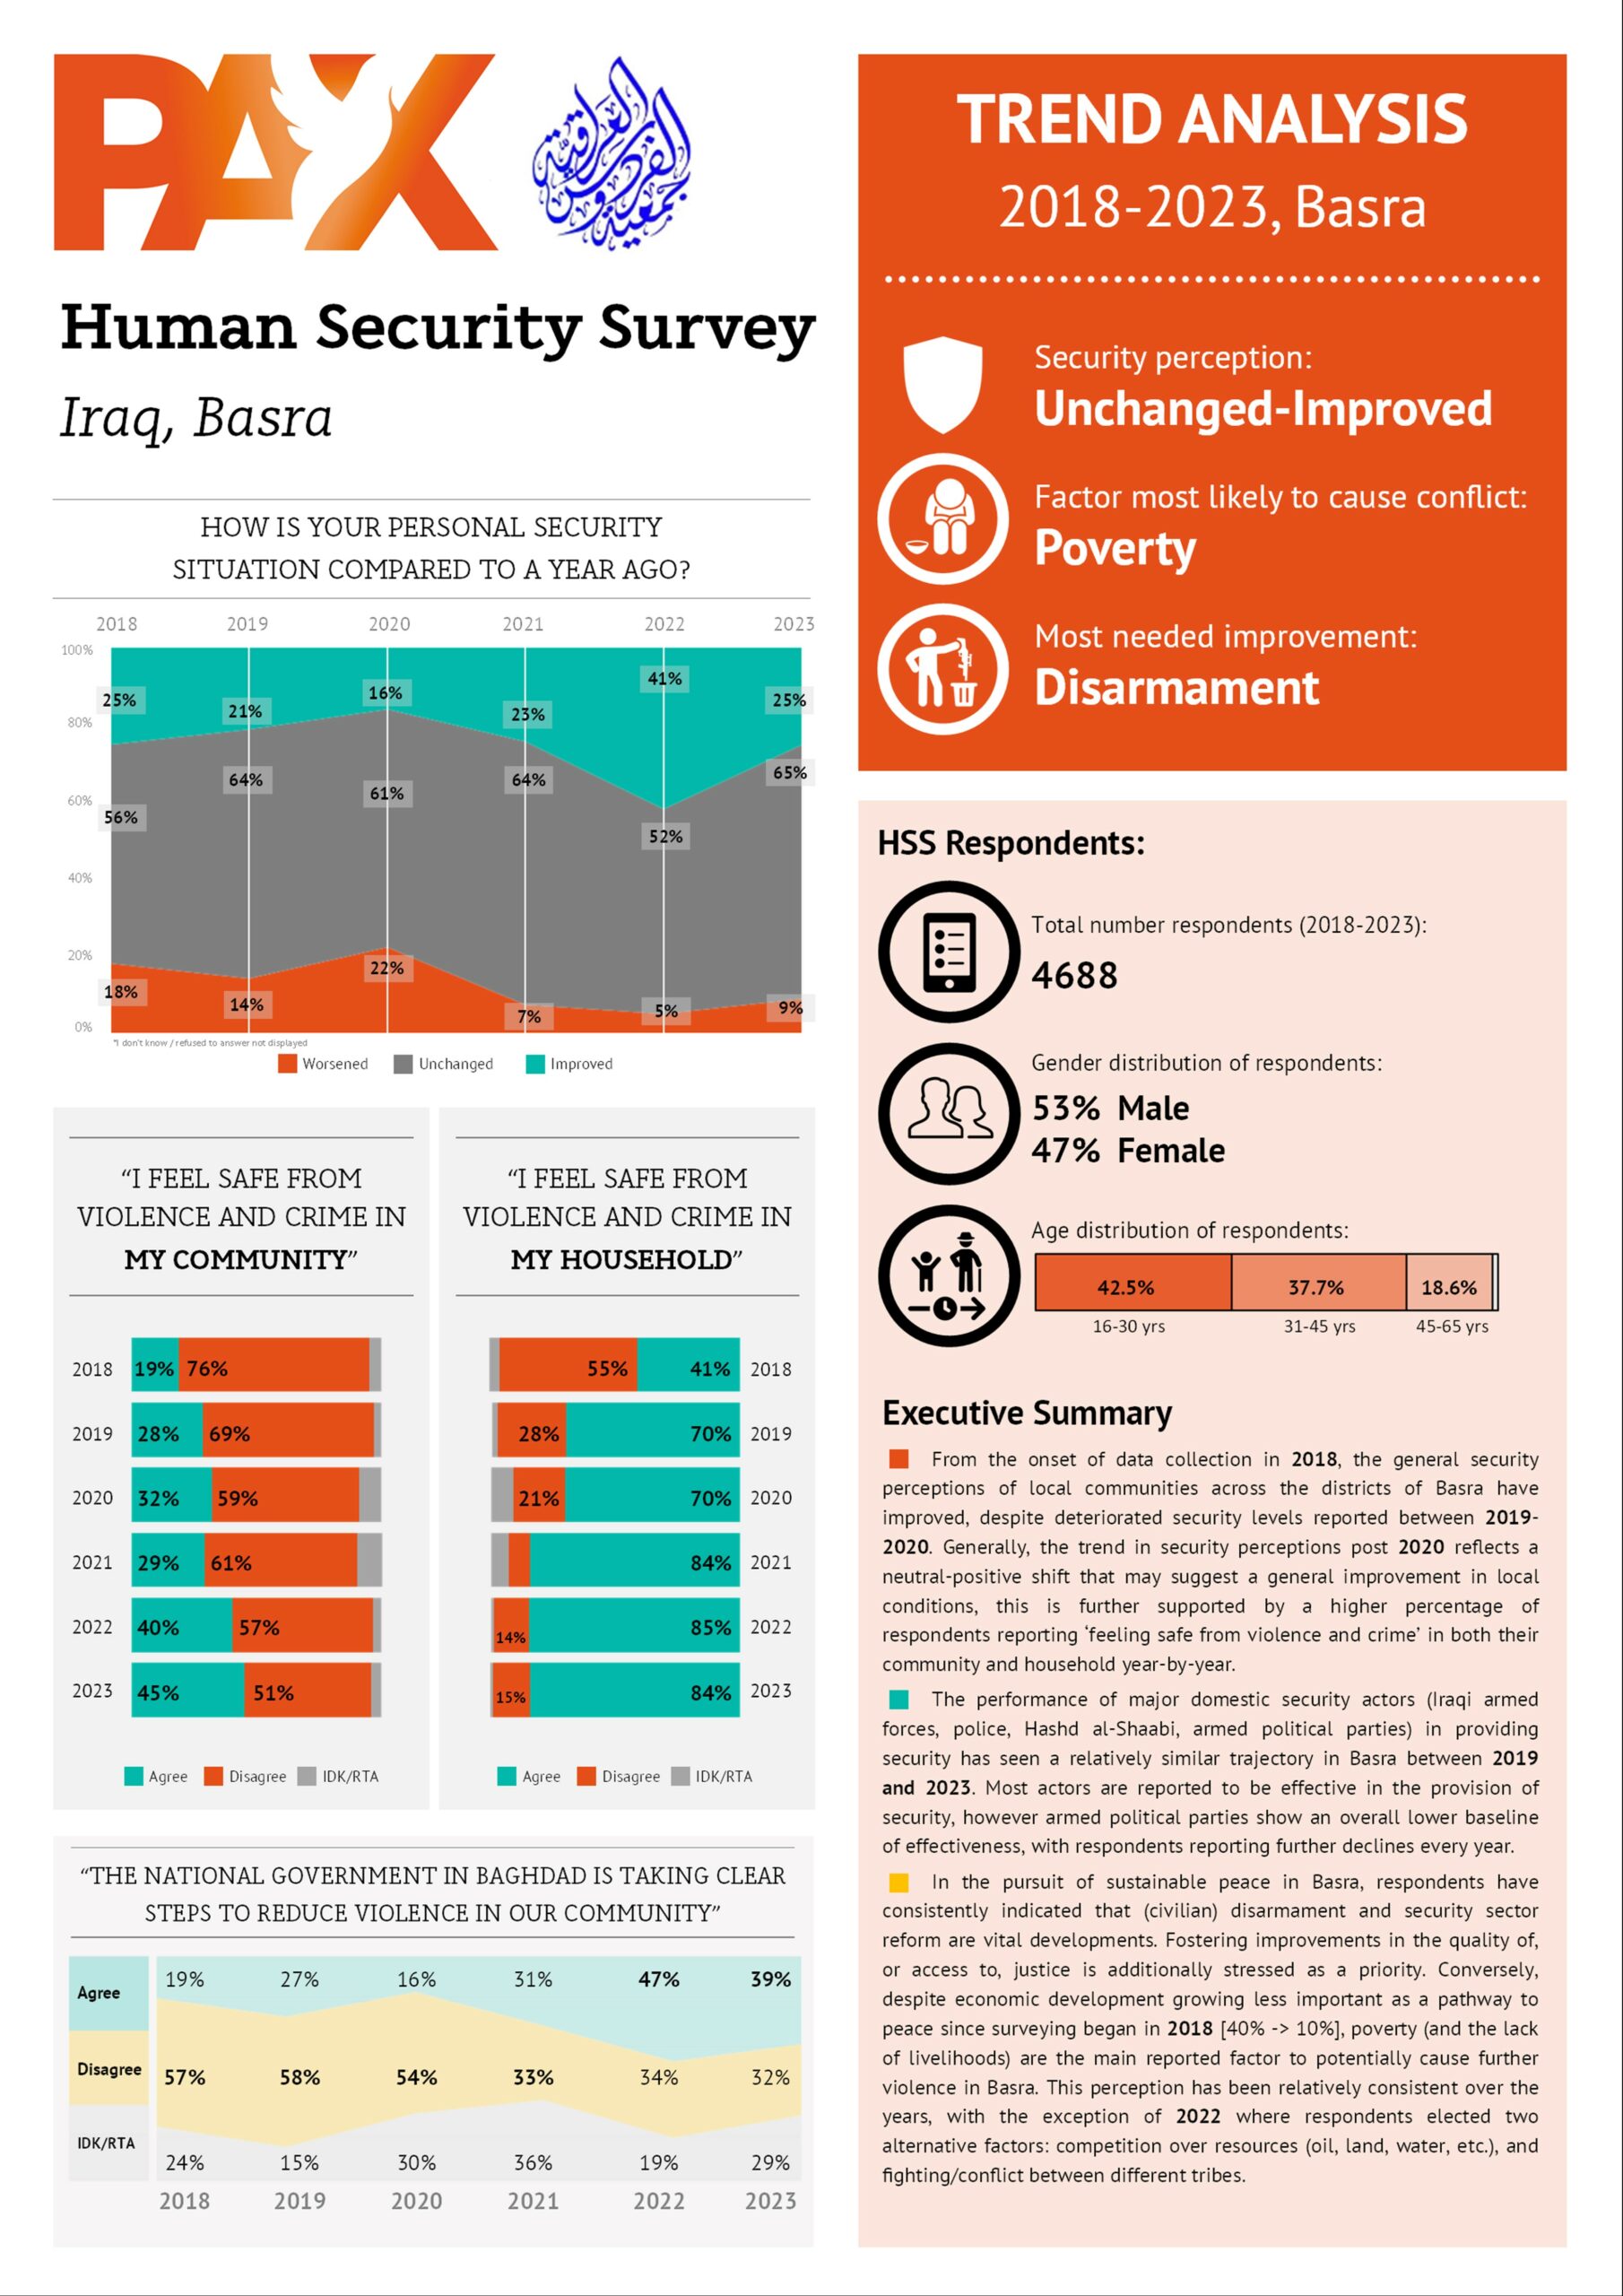
- Security perception: Unchanged-Improved
- Factor most likely to cause conflict: Poverty
- Most needed improvement: Disarmament
Executive Summary
- From the onset of data collection in 2018, the general security perceptions of local communities across the districts of Basra have improved, despite deteriorated security levels reported between 2019-2020. Generally, the trend in security perceptions post 2020 reflects a neutral-positive shift that may suggest a general improvement in local conditions, this is further supported by a higher percentage of respondents reporting ‘feeling safe from violence and crime’ in both their community and household year-by-year.
- The performance of major domestic security actors (Iraqi armed forces, police, Hashd al-Shaabi, armed political parties) in providing security has seen a relatively similar trajectory in Basra between 2019 and 2023. Most actors are reported to be effective in the provision of security, however armed political parties show an overall lower baseline of effectiveness, with respondents reporting further declines every year.
- In the pursuit of sustainable peace in Basra, respondents have consistently indicated that (civilian) disarmament and security sector reform are vital developments. Fostering improvements in the quality of, or access to, justice is additionally stressed as a priority. Conversely, despite economic development growing less important as a pathway to peace since surveying began in 2018 [40% -> 10%], poverty (and the lack of livelihoods) are the main reported factor to potentially cause further violence in Basra. This perception has been relatively consistent over the years, with the exception of 2022 where respondents elected two alternative factors: competition over resources (oil, land, water, etc.), and fighting/conflict between different tribes.
Scroll past the PDF viewer for more details on the employed research methods, demographics of respondents, and methodological choices.
About this infographic
Date of publication:
Feb 08, 2024
Author:
Abdullatif Sleibi & Saba Azeem
Publisher:
PAX Protection of Civilians
Period:
2018-2023
HSS 2018-2023: Trend analysis of Basra, Iraq (English)
Feb 08, 2024, Abdullatif Sleibi & Saba Azeem
Read the document here
Methodology
Research methods & respondents Dates & locations This infographic reports on data collected in Basra (Iraq) over a period of 6 rounds: March 2018, March 2019, April 2020, April 2021, November 2022, and September 2023. Demographics The HSS enumerators collected 4688 surveys in Basra since 2018: 752 respondents in 2018, 816 in 2019, 822 in 2020, 746 in 2021, 782 in 2022, and 770 respondents in 2023. In 2018-2023, about 53% of respondents were men. In 2023, the gender distribution was more or less even [50.1% female to 49.9% male]. The age distribution was relatively stable across the survey rounds: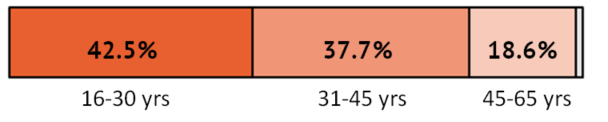
Questions
- Please note that respondents were only asked the question "How would you rate the performance of [security actor] in providing security in your area?" if they indicated in the previous question that the security actor was present. These "present" percentages are as follows:
- Iraqi Armed Forces (IAF): 62.5% (2019), 43.4% (2021), 20.3% (2023)
- Police: 85.3% (2019), 69.4% (2021), 66.5% (2023)
- Hashd al-Shaabi (PMF): 43.4% (2019), 5.1% (2021), 8.3% (2023)
- Armed Political Parties: 23.7% (2019), 4.6% (2021), 7.8% (2023)
Methodological & visualization choices Removal of percentages
- To facilitate trend analysis, we prioritized global trends over specificity. We omitted some percentages from graphs, as they would draw focus to individual data points. Instead, we highlighted changes over years by using connecting line graphs and adding confidence interval bars to column charts where possible.
- Nevertheless, these exact numbers are available on the HSS Iraq dashboard. Have a look or reach out to us and we will gladly provide more details. (Please note that, to improve legibility of our publications, categories are combined in a fashion appropriate to each individual publication, so some values may differ.)
- The HSS does not survey all residents in its survey locations, but uses sampling methods. As such, our research findings are always an approximation of the true values in the population. We sincerely hope that every reader of our publications is aware of this. When displaying data points from several years side by side with the intent to perform some kind of comparative analysis, it becomes even more prudent to emphasize this uncertainty.
- To that end, we have included 95% confidence interval (CI) bars to graphs that visually allow for them, most notably the column charts. A 95% CI means that, statistically speaking, there is only a 5% chance that the true value is not between the upper and lower limits of the CI. In other words, based on our sample, we can say with 95% certainty that the true value is included in the span of the CI bars.
- As our aim is to conduct applied research leading to timely and practical results, we did not perform statistical tests on the data. The recommendations and conclusions are based on viewing the data, using multiple data points to support the assertions, in combination with the contextual knowledge of our staff.
- Questions included in this infographic stayed more or less the same in the reported years. Some questions and/or answer options were removed or (re)introduced over the years, which is why in a few graphs, some data points are missing.
- In column and bar charts, a missing column means that no data is available for that year.
- In line graphs, the line starts later if the first data point is missing or ends sooner if the last data point is missing. If a middle data point is missing, the two known data points are connected by a dotted line.
 Go to HSS-Iraq project page Go to HSS-Iraq data dashboard